The support report a team lead needs every Monday: 6 questions and the conversations behind each number
A Monday report full of numbers gets skimmed and forgotten. These 6 questions tell a team lead what to read each week, how to read it, and which conversations to open behind every number that moved.
Contents
- Before you read a single number
- 1. How fast do customers get a first reply?
- 2. Which channel is growing?
- 3. When do customers write, and is anyone there?
- 4. Which label takes longest to resolve?
- 5. Who is overloaded?
- 6. Which conversations pulled CSAT down?
- If you only do two of these
- The whole report on one Deskwoot board
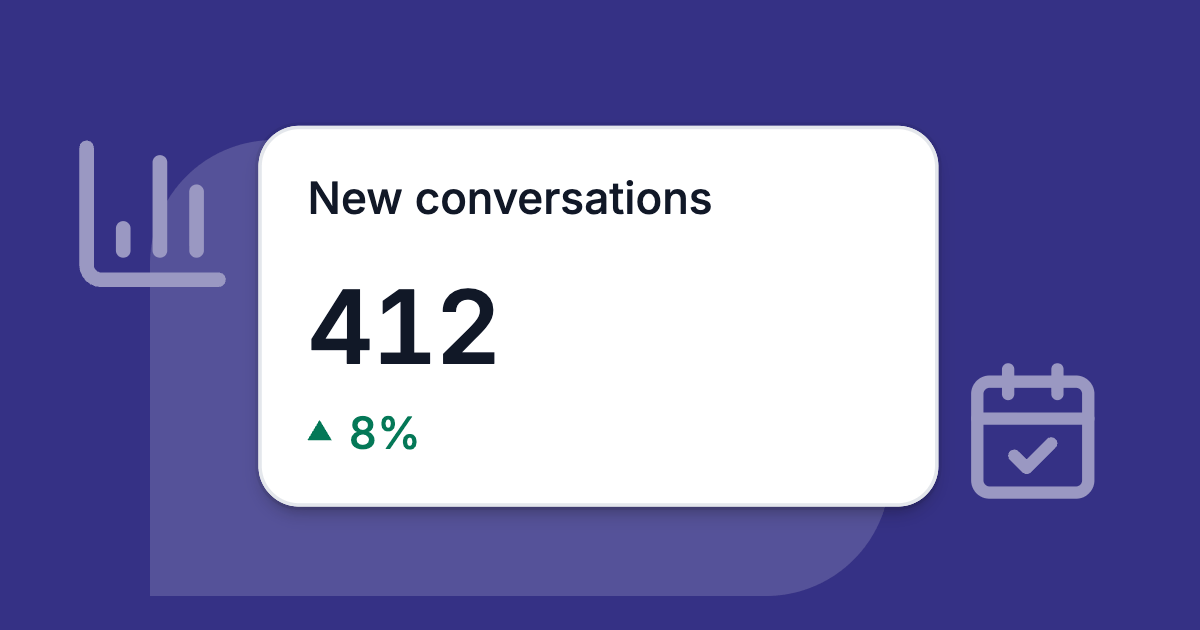
Your Monday support report is a row of numbers: 412 conversations, first response 47 minutes, CSAT 88. People nod, nothing changes, and the same row comes back a week later.
This report is built for a team of 3 to 20 people: 6 questions, the number that answers each one, and the conversations to open behind it. It works with any help desk that has decent reports.
Before you read a single number
- Use the same window every week: the last 7 days against the 7 days before, with the same definitions. If you counted first response in business hours last week and in calendar hours this week, the change you see is the definition moving.
- Wait for 2 weeks before you react. GitLab's support managers review their key metrics every week and form a group to analyze the cause once a metric sits at or below its floor for 2 sustained weeks (GitLab Support handbook).
- A small team needs that second week even more. With 40 or 50 conversations a week, one bad Friday moves every average.
- Open 3 conversations behind every number that moved. The reason for a change usually sits in the first few conversations you read.
1. How fast do customers get a first reply?
A first response of 47 minutes tells you very little until you open the 9 conversations that waited more than 4 hours and see that 7 of them arrived on Saturday.
Skip the average
Read the median and the 90th percentile. The median says what a typical customer waited, the 90th percentile how long the unlucky tenth waited. A handful of weekend messages can double the average while nothing changed during your opening hours.
Count the slow ones and write down why
Look at the slow end directly: how many conversations waited more than 4 hours for a first reply, and why. Write the reasons down in plain words:
- arrived Friday night
- sat unassigned
- landed in the wrong inbox
- waited on a colleague
After 2 or 3 weeks the list shows whether you have a staffing or a routing problem.
Deskwoot's First response counts the customer's whole wait, queue time included, and a click on it lists those conversations (see the conversations behind a number).
2. Which channel is growing?
Count new conversations per channel and compare them with the week before. When WhatsApp goes from 40 to 70 conversations a week while email stays flat, WhatsApp is the channel whose canned replies, hours and staffing were planned for a smaller load.
2 traps before you plan shifts
- Percentages on small numbers. A channel that went from 4 to 8 conversations grew 100%, and that means nothing yet.
- Growth with a single cause, like a newsletter, a delivery delay or a new ad. Open the new conversations and check whether half of them ask the same thing.
In Deskwoot, a click on the change under Conversations names the channel, team, inbox and label that moved it most, where one stands out.
3. When do customers write, and is anyone there?
Check your opening hours against when the inbox actually fills. Count new conversations by weekday and hour over the last 30 days (one week is too thin) and lay your hours over the result.
GitLab's support team names the fix on its KPI page: "Focused staffing to key time gaps with higher level of ticket SLA breaches" (GitLab, Customer Support Department Performance Indicators).
A worked example
Say 1 in 8 conversations arrives on weekdays between 6 and 9 pm and waits until the next morning. Moving one person's day from 9 am to 5 pm over to 1 pm to 9 pm answers them the same evening without a new hire.
That only works if the same heatmap shows your mornings can spare that person.
Deskwoot's When customers write block is that heatmap, and its working hours switch each agent Online and Offline on a schedule (working hours).
4. Which label takes longest to resolve?
Resolution time across the whole inbox mixes 2 minute questions with refunds that take 3 days. Split it by label and the slow topics stand out.
Then open the slowest conversations of a label and look at what they waited on: a refund approval, a supplier, a developer, the customer's photo of the damage.
One fix per slow label each week
Pick the fix from what you saw:
- a macro for the refund steps
- a help article for the question that keeps coming back
- a rule that sends the label to the person who can decide
If a third of your conversations carry no label at all, a third of your slow cases never show up under a topic. Then the first fix is labeling.
Deskwoot has labels on every plan from Startup, and its Resolution time by label block draws one bar per label, No label included.
5. Who is overloaded?
Queueing theory has an uncomfortable rule. In its simplest model, one person working through one queue (the M/M/1 queue), the average customer's wait grows fast as that person gets busier:
- busy 80% of the time: 4 times as long as the work itself takes
- busy 90% of the time: 9 times
- busy 95% of the time: 19 times
Support work is messier, since agents juggle several chats, but the curve keeps its shape. The last few percent of load cost the most waiting.
Look for 2 signals together
One person has clearly more conversations than the rest, and that person's first response got slower than last week. Measure it from the moment they had the conversation, so queue time does not count against them.
Either signal alone says less. A high count with steady times often means that person gets the quick questions. A slow first response with a normal count may mean they took the hard ones.
Keep this table out of the team meeting
Rank people by first response and they learn to send a quick "looking into it" that stops the clock and helps nobody. Use the numbers to move work and to start a 1:1.
Deskwoot's Agents table starts an agent's first response when they got the conversation (agent performance). To move work, lower one person's limit for live chat or email (1 to 200 open and pending conversations), and round robin gives new conversations to the online teammate with the least work (auto assignment).
6. Which conversations pulled CSAT down?
Qualtrics, a survey software vendor, defines CSAT as the share of ratings of 4 and 5 on a scale of 1 to 5. The same page warns that the people who answer are likely those with a very positive or a very negative experience (Qualtrics, vendor content).
So the score describes the people who bothered to answer, and on a small team it swings hard. With 15 ratings in a week, 2 ratings of 1 instead of 5 take the satisfied share from 87% to 73%.
Sort the low ratings into piles
Read the low ratings one by one and put each in a pile:
- The product: it broke or arrived late.
- The policy: no refund after 30 days.
- The reply: slow, wrong, curt, or passed between 3 people.
Only the last pile is a coaching topic. The other two go to whoever owns the product or the policy, with the conversations attached. For the survey question itself, see our guide to customer feedback surveys.
Deskwoot sends CSAT surveys from the Business plan once a conversation is resolved, and a click on the 1 in its Ratings block shows those ratings with the customer's comments.
If you only do two of these
Start with questions 1 and 6: how long customers waited and who left unhappy. Open 3 conversations behind each, agree on one change, and check it the Monday after.
Add the other 4 questions once those 2 are a habit.
The whole report on one Deskwoot board
Deskwoot is our help desk, and this whole report fits on one of its Reports boards:
| Question | Block and setting | What to click |
|---|---|---|
| How fast is the first reply? | First response on Median, with a goal; Waited too long, 4 hours | The number, longest wait first |
| Which channel is growing? | By channel next to Conversations; Compare with the previous 7 days | The change under Conversations |
| When do customers write? | When customers write, read on Last 30 days once a month | The busiest cells outside your hours |
| Which label takes longest? | Resolution time by label | The longest bar |
| Who is overloaded? | Agents table; Backlog right now by team | An agent's count |
| Which conversations pulled CSAT down? | Ratings; Latest comments; CSAT by label | The 1 and the 2 in Ratings |
Set it up once
The Team lead template under Start a view from already has a first response goal of 30 minutes, Waited too long at 1 hour, the backlog by team and the Agents and Teams tables. Add the other blocks, then save the board with Done.
An administrator can make that view the Default for everyone who sees Reports (arrange Reports and save views). On Enterprise, a custom role can open Reports to agents, who see only their assigned conversations (who can see Reports).
Administrators and roles with Export reports can download every list behind a number as CSV (exporting reports as CSV).
What it costs and how to try it
Reports come with every paid plan from Startup, at $4 per agent a month or $3.20 billed yearly. CSAT surveys and teams need Business at $8 (plans and prices).
To try it, sign up and pick Team lead in Reports, so the board is ready for your first Monday. The 7 day Enterprise trial needs no credit card and covers up to 30 seats including yours.
After the trial you pick a plan or keep working on the free Hacker plan for 1 agent, which has no Reports.
Also available in:DeutschEspañolFrançaisPortuguês (Brasil)